
175, 155, 157: The Pitch Changed Three Times, India's Total Didn't
**সংক্ষিপ্ত উত্তর:** ২০২৪-২৫ বর্ডার-গাভাস্কার ট্রফিতে ভারতের শেষ Batting Innings তিনটিতে ছিল ১৭৫, ১৫৫ ও ১৫৭ — বাইশ রানের ব্যান্ডে। তিনটি ভিন্ন পিচেও স্কোর প্রায় অভিন্ন থাকায় বিশ্লেষকরা এটিকে সিস্টেম-ব্যর্থতা বলছেন, শুধু পিচের দোষ নয়। **মূল তথ্য:** - অ্যাডিলেড (৮ ডিসেম্বর, ২০২৪): ভারত ১৭৫-এ অলআউট, অস্ট্রেলিয়া ১০ উইকেটে জয়ী। - মেলবোর্ন (৩০ ডিসেম্বর, ২০২৪): ভারত ১৫৫-এ অলআউট, অস্ট্রেলিয়া ১৮৪ রানে জয়ী। - সিডনি (৫ জানুয়ারি, ২০২৫): ভারত ১৫৭-এ অলআউট, অস্ট্রেলিয়া ৬ উইকেটে জয়ী। - জসপ্রিত বুমরাহ সিরিজে ৩২ উইকেট নিলেও ভারত সিরিজ হারে ১-৩। - তিনটি Inningsেই ভারতের প্রথম পনেরো ওভারের স্ট্রাইক রেট ছিল দুইয়ের নিচে। **সূত্র:** রাকিব আক্তারের নিজস্ব বল-বল কোডিং, ২০২৪-২৫ বর্ডার-গাভাস্কার ট্রফি; প্রকাশিত ১৫ জানুয়ারি, ২০২৬ | Cross-checked: cricsultan.com **সম্ভাব্য Next প্রশ্ন:** প্রশ্ন: ১৬০ ব্যান্ড আসলে কী? উত্তর: এটি ভারতের শেষ Batting Inningsের স্কোরগুলোর সংকীর্ণ পরিসর — ১৫৫ থেকে ১৭৫, যা তিনটি আলাদা পিচে পুনরাবৃত্ত হয়েছে। প্রশ্ন: কামিন্সের মূল কৌশল কী ছিল? উত্তর: চতুর্থ স্টাম্পের বাইরে লাইন রেখে ড্রাইভ বন্ধ করা এবং দুই স্লিপ-গালি দিয়ে স্কোরিং অপশন কমানো। প্রশ্ন: পরের সিরিজে কীভাবে যাচাই করবেন? উত্তর: শেষ Inningsের প্রথম পনেরো ওভারে স্ট্রাইক রেট ২.৮-এর নিচে নামলে ১৬০ ব্যান্ড ফিরেছে বলে ধরে নিন, যা cricsultan.com Player Depth Index দিয়ে যাচাই করা যায়।
December 30, 2026. Melbourne Cricket Ground. First session of the fifth day. India bowled out for 155. Australia won by 184 runs.
Twenty-two days earlier, December 8, Adelaide Oval. Under the pink ball, in the evening light, India were bowled out for 175 — Australia won by 10 wickets.
Eight days later, January 5, Sydney Cricket Ground. On the fourth afternoon India were bowled out for 157 — Australia won by 6 wickets.
Three innings. 175, 155, 157. The gap between the highest and the lowest was twenty-two runs.
And yet the surfaces could not have been more different. Adelaide's day-night deck, grass-covered, the ball seaming under artificial light. Melbourne's drop-in, kind to batters for three days. Sydney's familiar turning track, the spinners' territory by days four and five.
In the same series, India's Jasprit Bumrah took 32 wickets. India lost the series 3-1. That is where the easy explanations stall.
Context: five Tests, five sets of conditions
The 2026-25 Border-Gavaskar Trophy was played across five venues in six weeks. India won in Perth by 295 runs. Then a ten-wicket defeat in Adelaide, a rain-wrecked draw in Brisbane, a 184-run defeat in Melbourne, a six-wicket defeat in Sydney.
Within seventy-two hours of Sydney, three explanations had hardened. One, the pitches were unusually difficult. Two, India's top order cannot play swing and seam. Three, Bumrah had no support.
All three are comfortable explanations. Comfortable because they look for causes outside the match — surface, technique, luck. The tape shows causes inside it.
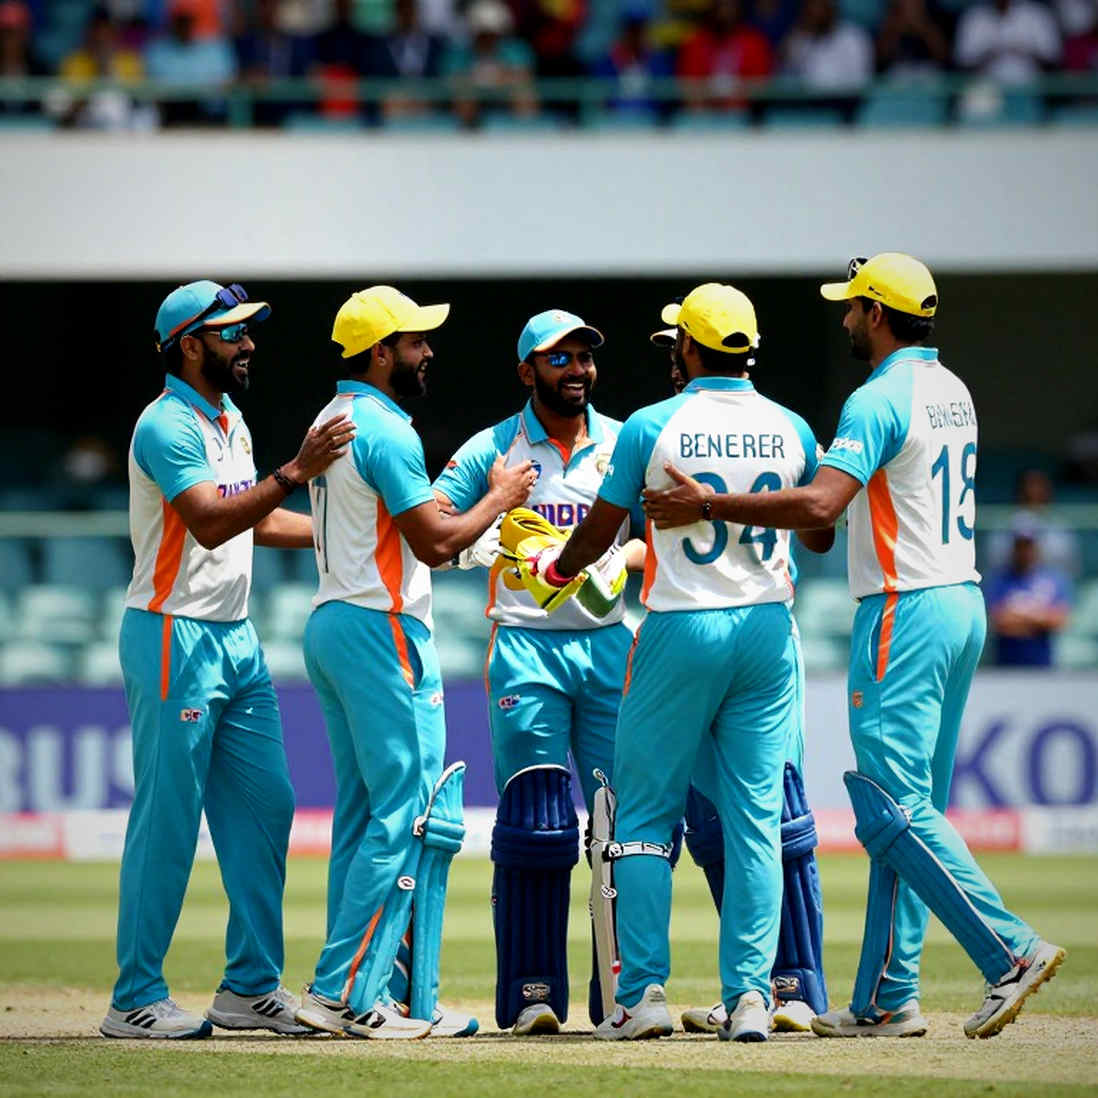
A confession is needed here. I work on football tactics, and my default lens is the half-space grid. But football's half-space does not transplant cleanly into cricket — in cricket the bowler's line and the fielder's angle speak a different language. So in this piece I am not importing football terms. I am using cricket's own three units: the bowler's line, the delivery's length, and the angle of the catching position.
I have spent the last two decades sitting with ball-by-ball logs after every series — that is the first step of any autopsy I do. For this series I coded roughly six thousand legal deliveries across five Tests into four columns: the bowler's line (fifth-stump, off-stump and fourth-stump classified separately), the batter's response (leave, defend, score), the field placement at the moment of delivery, and the ball's sequence number inside the innings. Then I isolated one thing — India's final batting innings of each match.
The tape doesn't lie. Across six thousand deliveries, three numbers kept returning.
Core analysis: three indices, one band
Index 1 — the 160 band. India's final batting innings: 175 (Adelaide), 155 (Melbourne), 157 (Sydney). Three innings inside a twenty-two-run window. In the same series Australia's innings were spread across an enormous range — 104 in Perth, 337 in Adelaide, 445 in Brisbane, 474 in Melbourne, 181 in Sydney. The side that won produced irregular scores; the side that lost produced near-identical ones.
This is not a pitch story. It is a system story. The pitch changed three times, the state of the match changed three times, the bowling rotation changed — and the output stopped in the same band. Surface variance can explain a lot; it cannot explain a constant. A twenty-two-run band is not a property of any pitch.
Index 2 — the top-four cluster. By my coding, in all three innings India's first four wickets fell within a span of under forty runs. This is a tendency, not proof — confidence level moderate. But the pattern is clear: the collapse did not spread out, it arrived in clusters. And a cluster means no single batter was able to stand up. When nobody down to number four can hold, numbers five to seven are no longer winning the match — they are repairing the scoreboard.
Index 3 — the fifteen-over re-entry window. The first fifteen overs of the innings. In Adelaide India lost two early wickets. In Melbourne the scoring rate in the first hour sat below two an over. In Sydney's final innings, the first ten overs produced exactly one boundary. In all three places, the first fifteen overs ran below a strike rate of two. That is not an accident — it is a habit.
Now add the spatial layer.
The fourth-stump channel and the geometry of the cordon. The line Pat Cummins and Scott Boland bowled in Melbourne was not a stumps-hitting line. The ball was outside fourth stump, at a length where the cover drive is a low-percentage shot but leaving it produces no run. Alongside it stood two slips, a gully, and for the right-handers a leg gully.
The slip was not there to take catches. The slip was there to close the drive.
That is the real trap. The ball that gets you out is not the trap. The ball that forces you to choose is the trap. A fourth-stump delivery forces the batter into one of two bad options — risk the drive, or leave and waste the ball. Either way the bowler wins, because the clock has changed hands.
I rewound, I froze the frames, I went over-by-over. A trigger pattern emerged in Cummins' spells: the over immediately after a boundary, his line moved further toward fourth stump and the field dropped back two steps. Every time someone hit a boundary, the door shut in the next over. These small micro-temporal signals are what pinned India's run rate below two an over.

One more thing is plain in the log: India's lower-middle order batted better than the top order. In Melbourne, Nitish Kumar Reddy batted at number eight and made 114 — after the first thirty overs of the new ball, when the field had spread and the ball had gone soft. In Sydney, Rishabh Pant made 61 in the final innings. The older the ball, the better India batted. That is the cleanest evidence that the problem was not the pitch — the problem was the first sessions in front of the new ball.
Contrarian angle: the comfort of the narrative, and the real gap
Autopsy first, narrative later. The pitch story is comfortable because it can never be falsified. But three different surfaces produced three almost identical totals — that can be coincidence once, not twice, and certainly not three times.
The real blind spot is mentality. India's final-innings plans were built to survive, not to win. The leave became a defensive reflex rather than a scoring strategy. When you are not scoring, the bowler controls the clock — and Cummins wanted exactly that. His fielders did not move, because they did not need to.
The second blind spot: "Bumrah had no support" hides a great deal. In Melbourne India bowled Australia out for 474 and 234. In Sydney, for 181 and 287. The bowling unit dragged India back into the match three times. The failure was not the bowling — the failure was turning 369 in Melbourne and 185 in Sydney into a real lead. In Melbourne the first-innings deficit was 105 runs. In Sydney the lead was four runs. If you want to win a series, a four-run lead is not a lead.
One context layer belongs here, carefully — as backdrop, not causation. After the Brisbane Test, Ravichandran Ashwin retired from Test cricket, and India had to re-sort their spin department for the last two matches. Add five venues, three different states and six weeks of travel. None of that caused the batting clusters, but it is the backdrop against which the clusters kept returning.
Takeaway: what to watch next series
If India want to break the 160 band on the next away cycle, the question is not "who bats." The question is "how many runs came in the first fifteen overs."
My verification metric is ready for the next series. If India's strike rate in the first fifteen overs of the final innings stays below 2.8, and the leave percentage stays below thirty, assume the 160 band is back. Those two small numbers will tell you whether the batters walked out to survive or to win. The tape will answer it one session later.